Your network can be the source of considerable log data. Unless you can make sense of the information, however, it won’t provide you with the knowledge needed to effectively maintain your network. GFI EventsManager has an integrated dashboard that offers filtering-enabled charts; they provide a single point of contact with all the data you need to work efficiently.
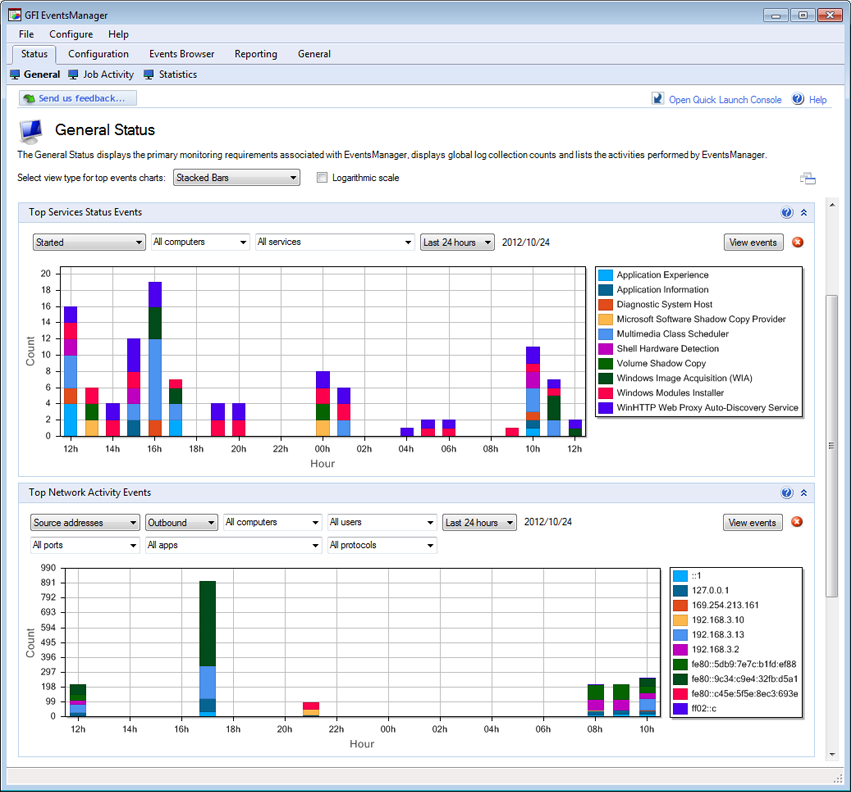
Event log monitoring charts include the top critical and high importance rules triggered within a certain period of time: the top 10 users who fail to log on, or users who log on during and outside working hours; the service status across your network; and the number of log records stored in the database per log type. There’s also a comprehensive graph based on Windows events that shows network connections at application and user level (available for Vista™ and newer Windows systems only).
It also shows a panel containing the monitoring statistics, fed with data from the check-based, active monitoring engine. The dashboard is highly customizable. Separate windows highlighting different and the most important real-time data from the logs can be automatically arranged on the desktop.