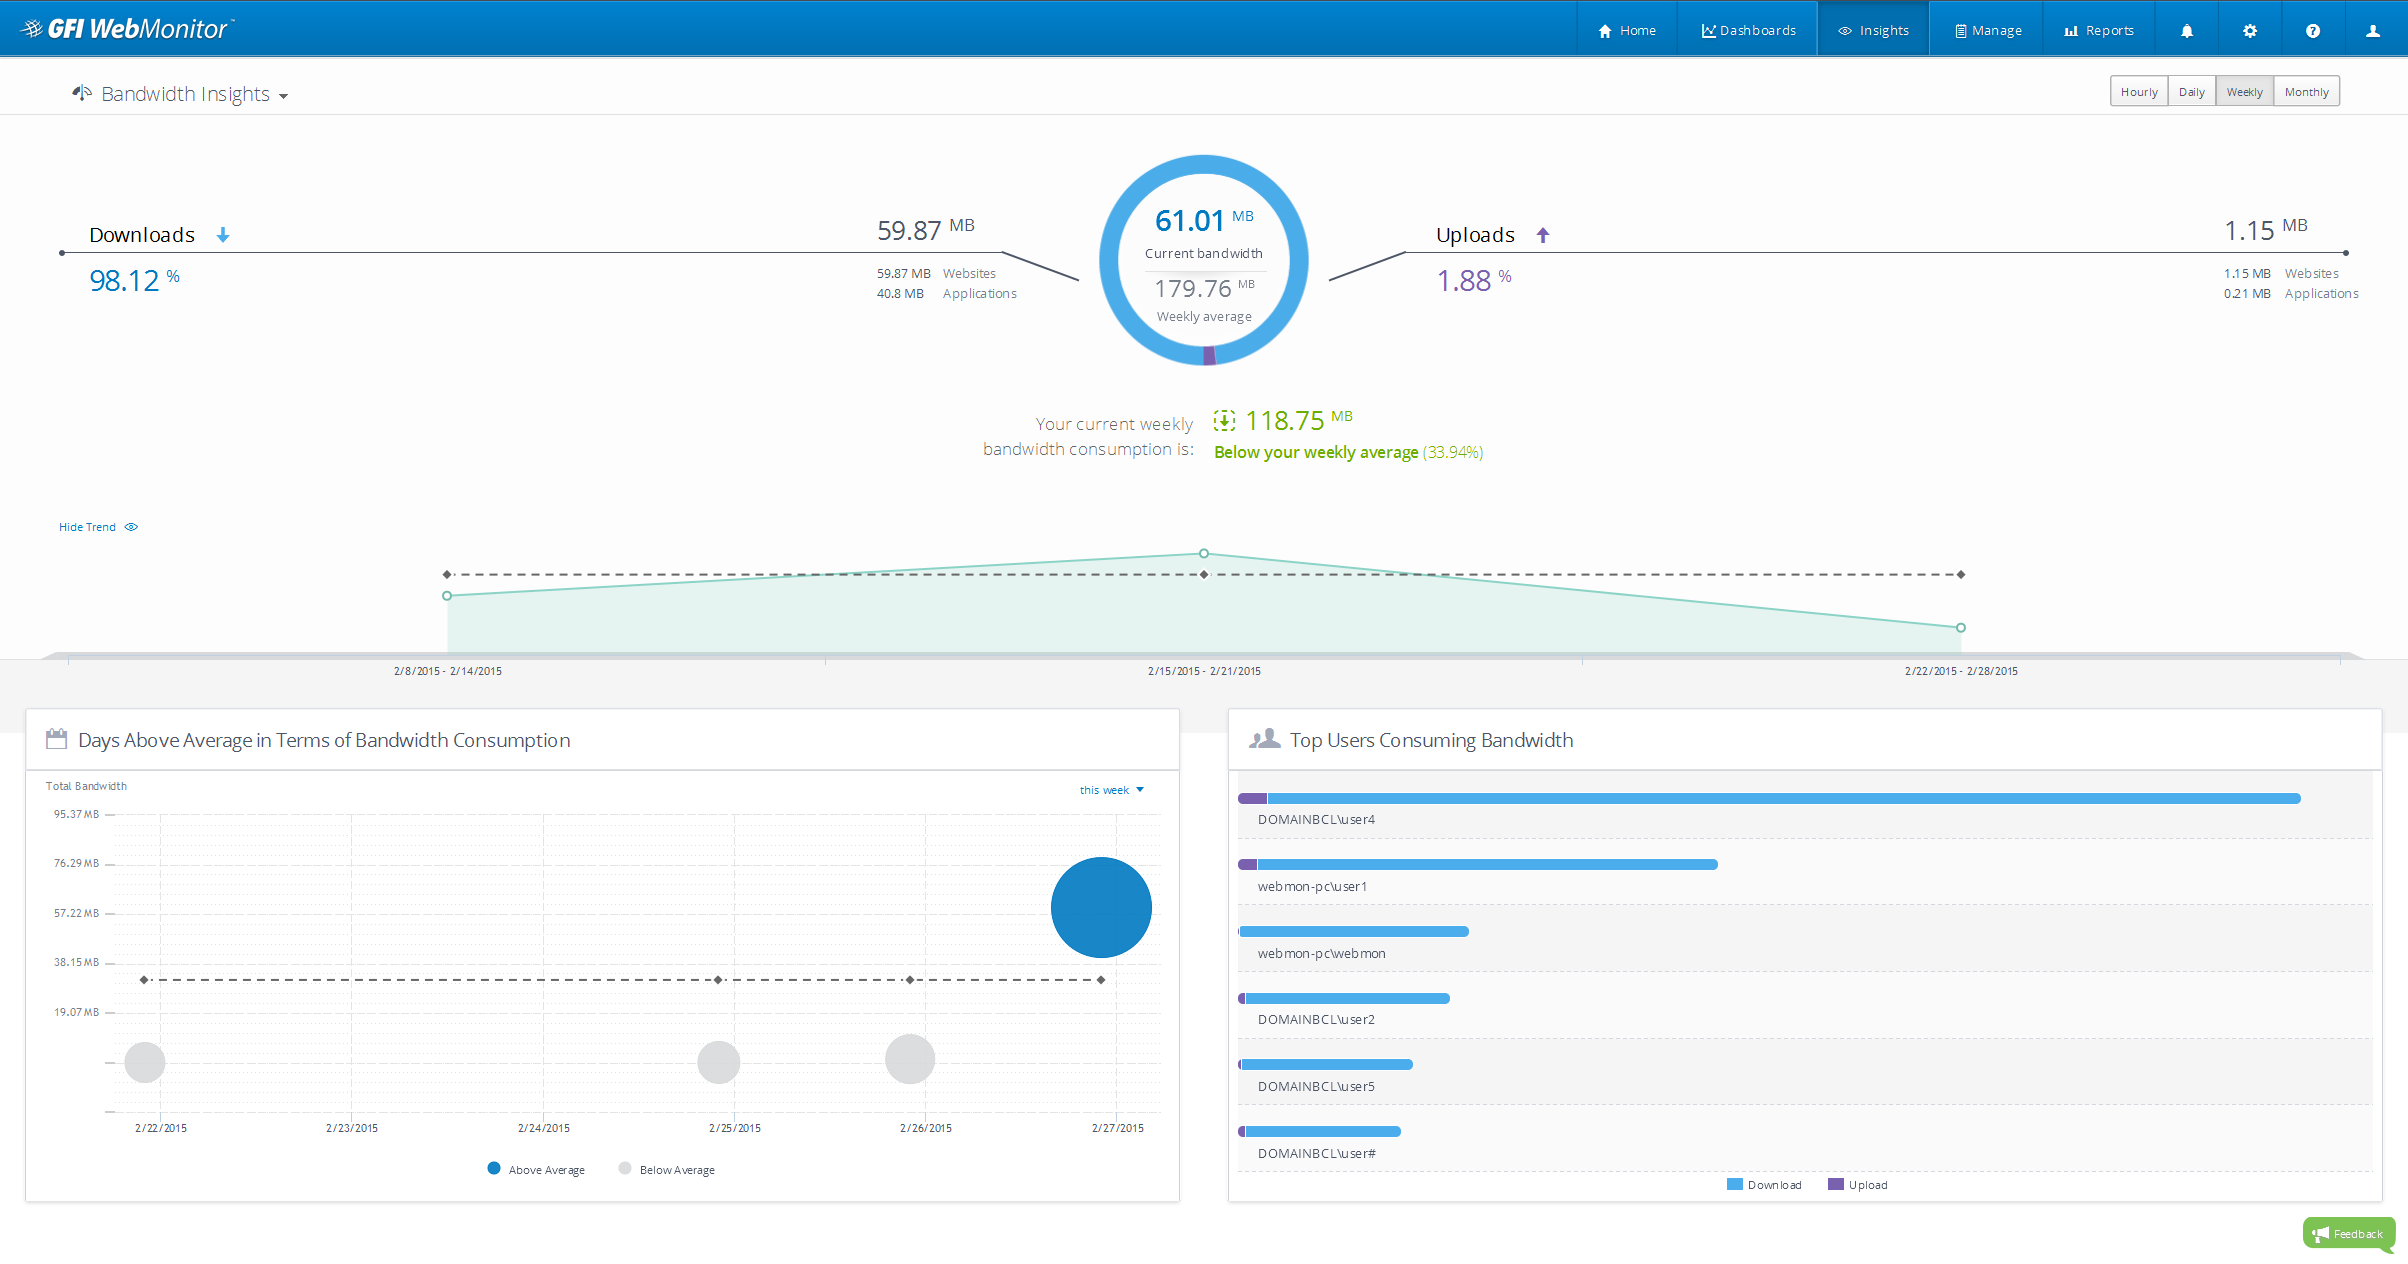
WebInsights deliver unprecedented visibility into key web activity and security metrics by creating a baseline for user behavior based on historical activity. WebInsights put the raw data into context, covering bandwidth consumption, security incidents or productivity concerns. These new dashboards help you analyze bandwidth usage, user activity and security incidents over time. This makes it much easier to know the status of your network when compared to the day before, a couple of weeks ago or last month.
The baseline helps you to make sense of the numbers, puts them in context and gives the answers to questions you have about productivity, bandwidth and security over a period of time.
To read more about WebInsights, click here.